Visualize Enviro Phat Sensors Data
Enviro pHat is an low-cost environmental sensing boards that let you measure temperature, light color, motion and analog sensors. The accompanied python SDK makes writing program to get data from enviro pHat as easy as pie. Enviro pHat could be used in combination with RaspPi zero to become a simple room conditions monitoring sensing board.
With grafana and prometheus, it looks so easy to at least build a dashboard for environ pHat sensors data, so I decided to build a enviro pHat dashboard.
System Diagram
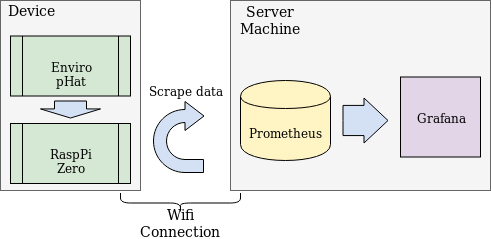
Though Enviro pHat provides SDK to get data from sensors, we need methods to that data to server. We also need to care about the connection between the device and server side. In home environment, I used Wifi as Pi Zero supports Wifi connections. Prometheus also provides scrape methods to fetch data from prometheus client, so I will add a prometheus client in the device side for prometheus server to scrape. The data is stored in prometheus data store and visualized by grafana.
Device Side
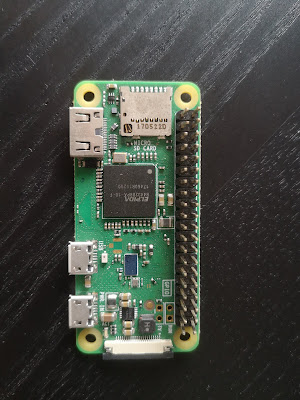
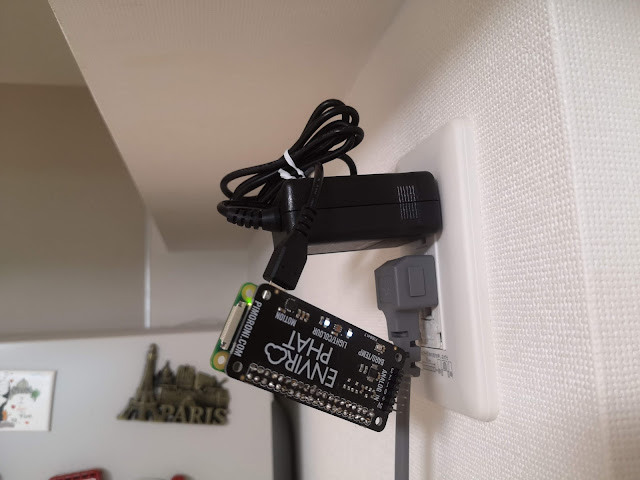
Soldering sensor board and setup OS If you buy an un-soldered Enviro pHat, you probably need to solder it with the accompanied 2x20 pin female header. The solder part is not that difficult and Pimoroni has a detailed guide for the task. Below are my raspberry Pi Zero and the Enviro pHat sensor board.
For the PiZero device, you need to download Raspbian and write it into the SDCard. Because we are going to connect to the Rasp Pi through Wifi, we need to setup wifi for Rasp Pi. After downloading the OS image and writing the OS image to the sd card, put the sd card into your PC, open the sd card directory and added 2 following files to the boot directory.
wpa_supplicant.conf
country=JP
ctrl_interface=DIR=/var/run/wpa_supplicant GROUP=netdev
update_config=1
network={
        ssid="WIFI SSID"
        psk="WIFI SSID PASSWORD"
        key_mgmt=WPA-PSK
}
ssh
empty content
The purpose of the ssh file is to tell raspbian to enable ssh server by default.
Plugin the power supply in. You should see Raspberry Pi IP address through your home router (Or ping the whole IP address segments to see which IP is assigned).
You should be able to ssh into the raspberry Pi through its IP address. Perform basic server setups
$ ssh pi@$PI_IP_ADDRESS
pi@$PI_IP_ADDRESS password: ****
$ [email protected]'s password:  0.567, 3: 0.51
Linux pizero 4.19.66+ #1253 Thu Aug 15 11:37:30 BST 2019 armv6l

The programs included with the Debian GNU/Linux system are free software;
the exact distribution terms for each program are described in the
individual files in /usr/share/doc/*/copyright.

Debian GNU/Linux comes with ABSOLUTELY NO WARRANTY, to the extent
permitted by applicable law.
Last login: Thu Oct  3 05:50:11 2019 from 192.168.88.254

$ sudo apt update
$ sudo vim /etc/hostname
$ sudo reboot
Final result
Install Enviro pHat SDK
$ curl https://get.pimoroni.com/envirophat | bash
$ pip3 install prometheus_client
$ git clone [email protected]:telescreen/raspizero-playground.git
$ cd raspizero-playground
$ python3 enviro-collectd.py -d -f enviro-collectd.log --pid enviro-collectd.pid
I write a program to export environ data through prometheus client: https://github.com/telescreen/raspizero-playground . After running the program like above, you should be able to confirm the prometheus data at
http://$PI_IP_ADDRESS:9090/
Server Side
I have LXD running in my local machine. I also have Juju bootstrapped with local cloud as cloud environment. As Juju store already provided prometheus2 and grafana charms, Installation of these middlewares is simply typing following 2 commands.
$ juju deploy prometheus2
$ juju deploy granafa
$ juju add-relation prometheuss:grafana-source grafana:grafana-source
It will take a while for Juju to download / install charm and necessary software. After Juju finishes installing granafa and prometheus, we should see both applciation active in Juju status
$ juju status
Model    Controller  Cloud/Region         Version  SLA          Timestamp
default  lxd         localhost/localhost  2.6.9    unsupported  16:19:07+09:00

App          Version  Status  Scale  Charm        Store       Rev  OS      Notes
grafana               active      1  grafana      jujucharms   32  ubuntu
prometheus2           active      1  prometheus2  jujucharms   11  ubuntu

Unit            Workload  Agent  Machine  Public address  Ports               Message
grafana/0*      active    idle   1        10.4.88.50      3000/tcp            Started grafana-server
prometheus2/0*  active    idle   0        10.4.88.243     9090/tcp,12321/tcp  Ready

Machine  State    DNS          Inst id        Series  AZ  Message
0        started  10.4.88.243  juju-63ab09-0  bionic      Running
1        started  10.4.88.50   juju-63ab09-1  bionic      Running
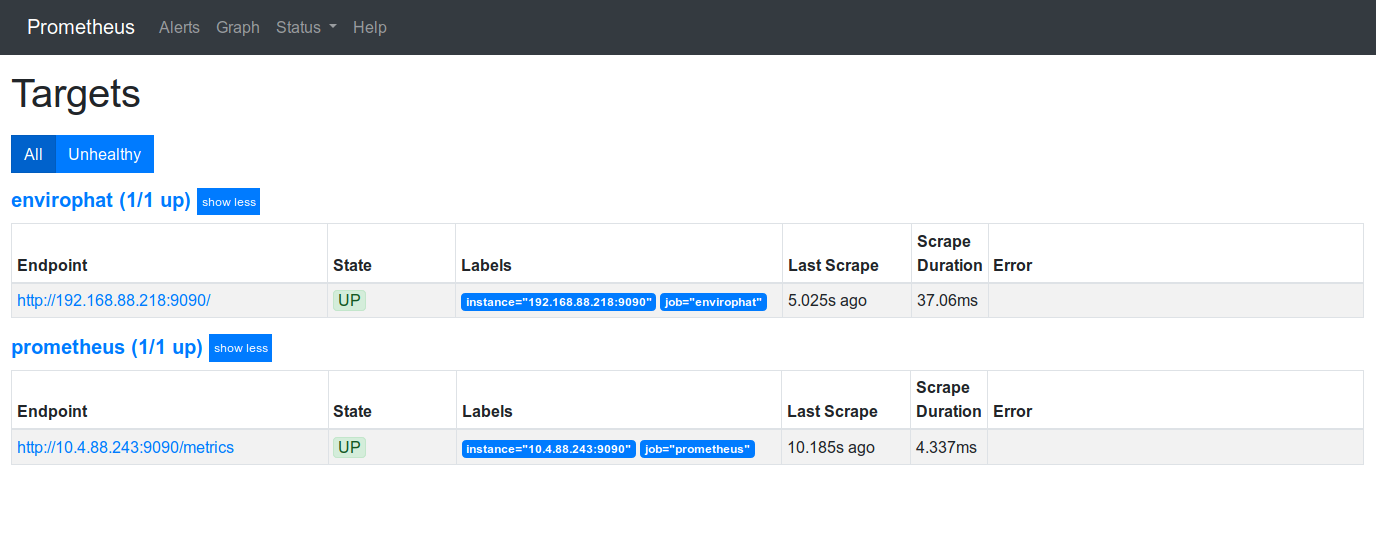
Next, we need to add the exposed prometheus data in the device to Prometheus’s scrape job. I prepare a simple scrape job setup at https://github.com/telescreen/raspizero-playground/blob/master/scrape-job.yaml
Adding the scrape job with Juju by following command
$ juju config prometheus2 [email protected]
Login into grafana with password retrieved by following actions. The other actions are performed through the grafana UI and quite intuitively, so I excluded those settings from this post.
$ juju run-action --wait grafana/0 get-admin-password
unit-grafana-0:
  id: 43e7d1e6-3251-437b-816d-d2aa182c5554
  results:
    password: NJBMMVNqW6ssKywL
  status: completed
  timing:
    completed: 2019-10-03 07:28:44 +0000 UTC
    enqueued: 2019-10-03 07:28:41 +0000 UTC
    started: 2019-10-03 07:28:44 +0000 UTC
  unit: grafana/0
Final Results
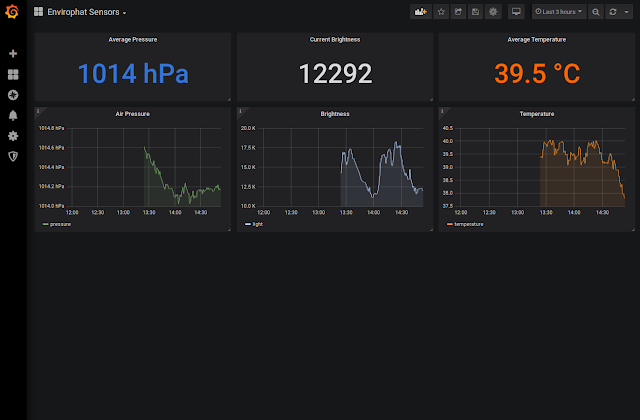
After like 3 hours, I could build the following dashboard for data captured by enviro phat’s sensors. The light change is due to I put the sensors in a dark zone in my room. My room is definitely cooler than the temperature that Enviro is capturing. Probably, the temperature is affected by the heat from pi zero.
The storm is approaching my city so I am expecting to see a lower than usual air pressure. The pressure should increase back in a few days after the storm.
I was able to build a simple home conditions’ monitoring system in a short time with opensource technology. I can felt more and more the importance of opensource softwares after this project.